Customising `coefplot`
arguments.Rmd
library(coefplot)
#> Loading required package: ggplot2
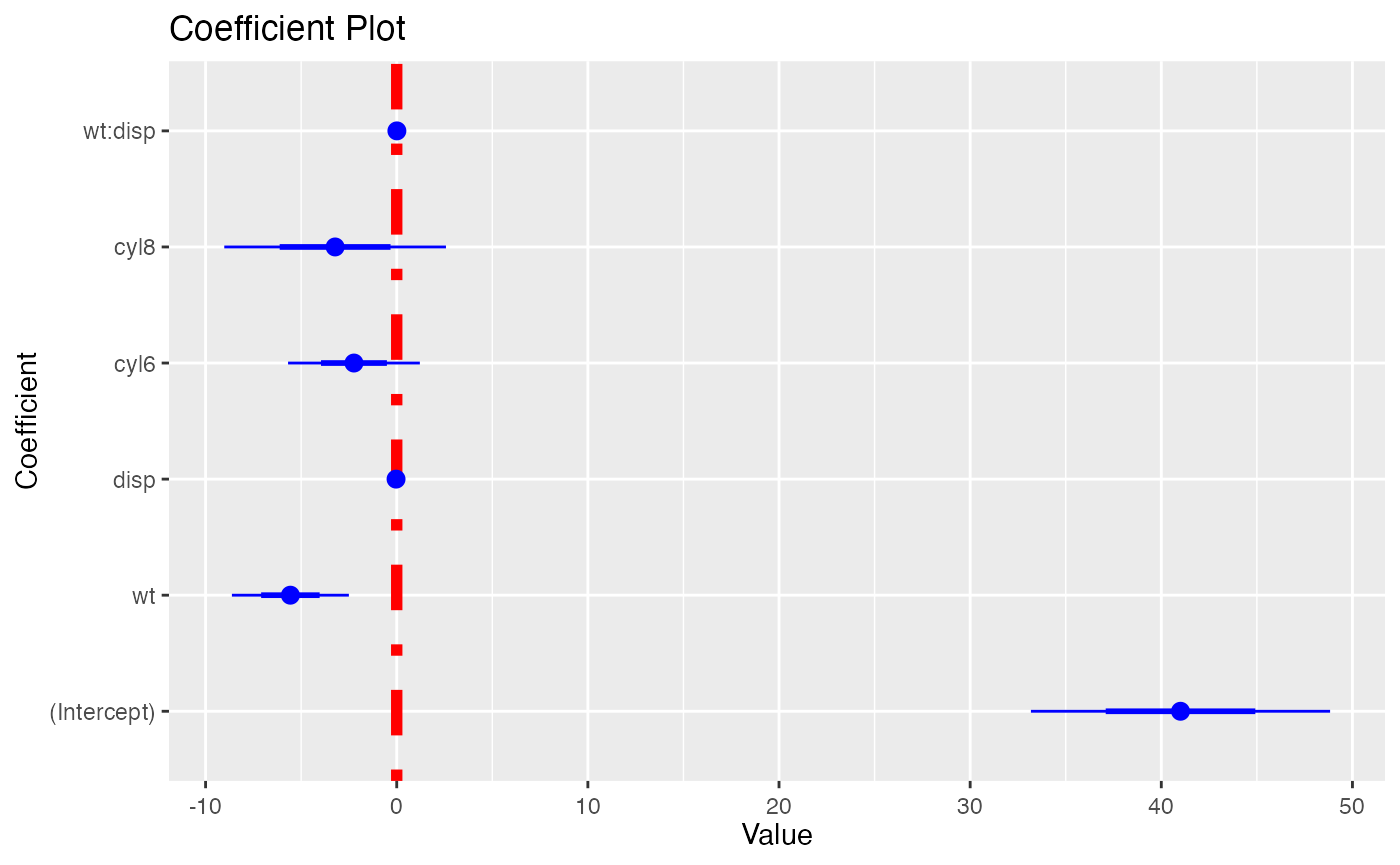
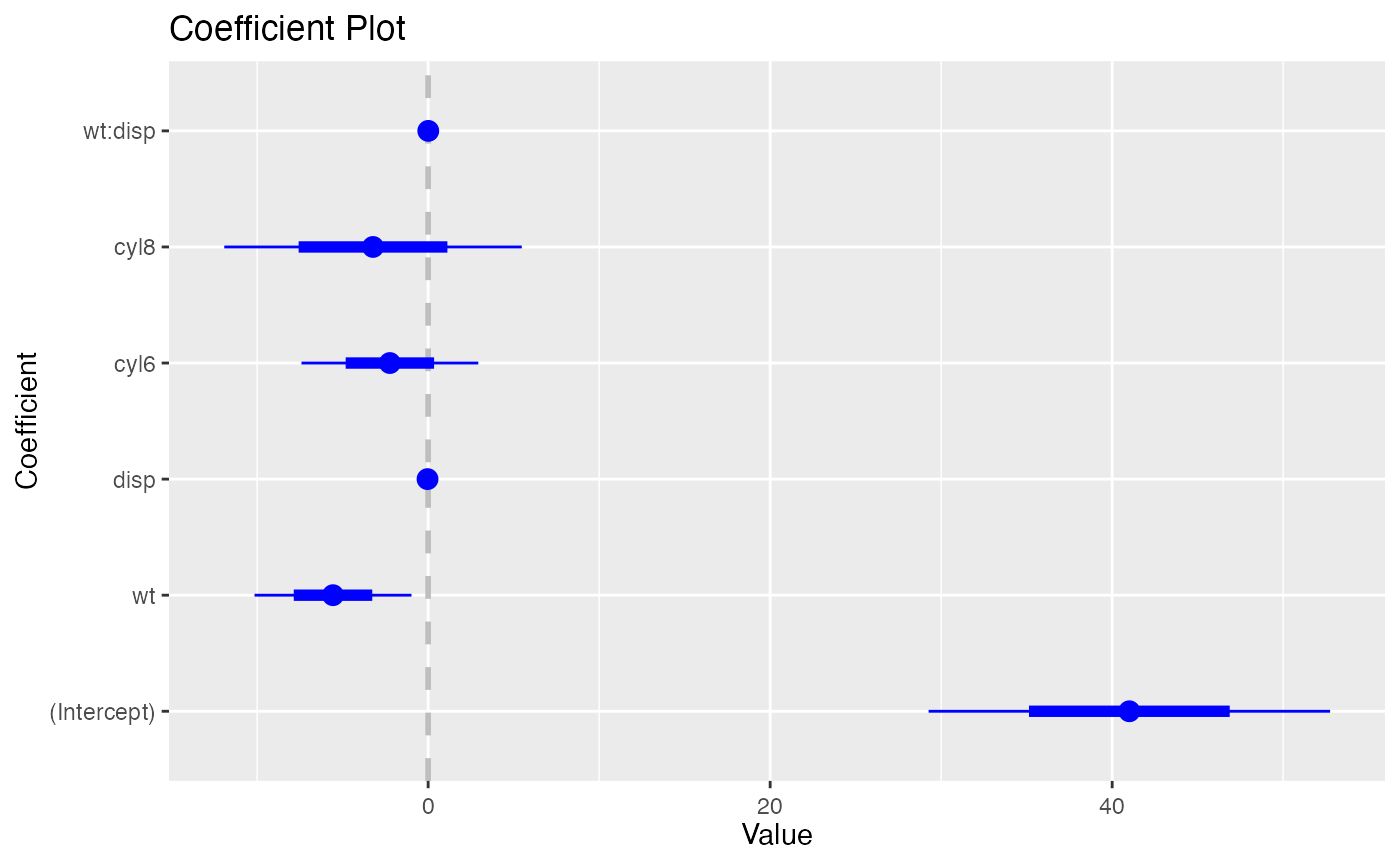
dt <- mtcars
dt$cyl <- as.factor(dt$cyl)
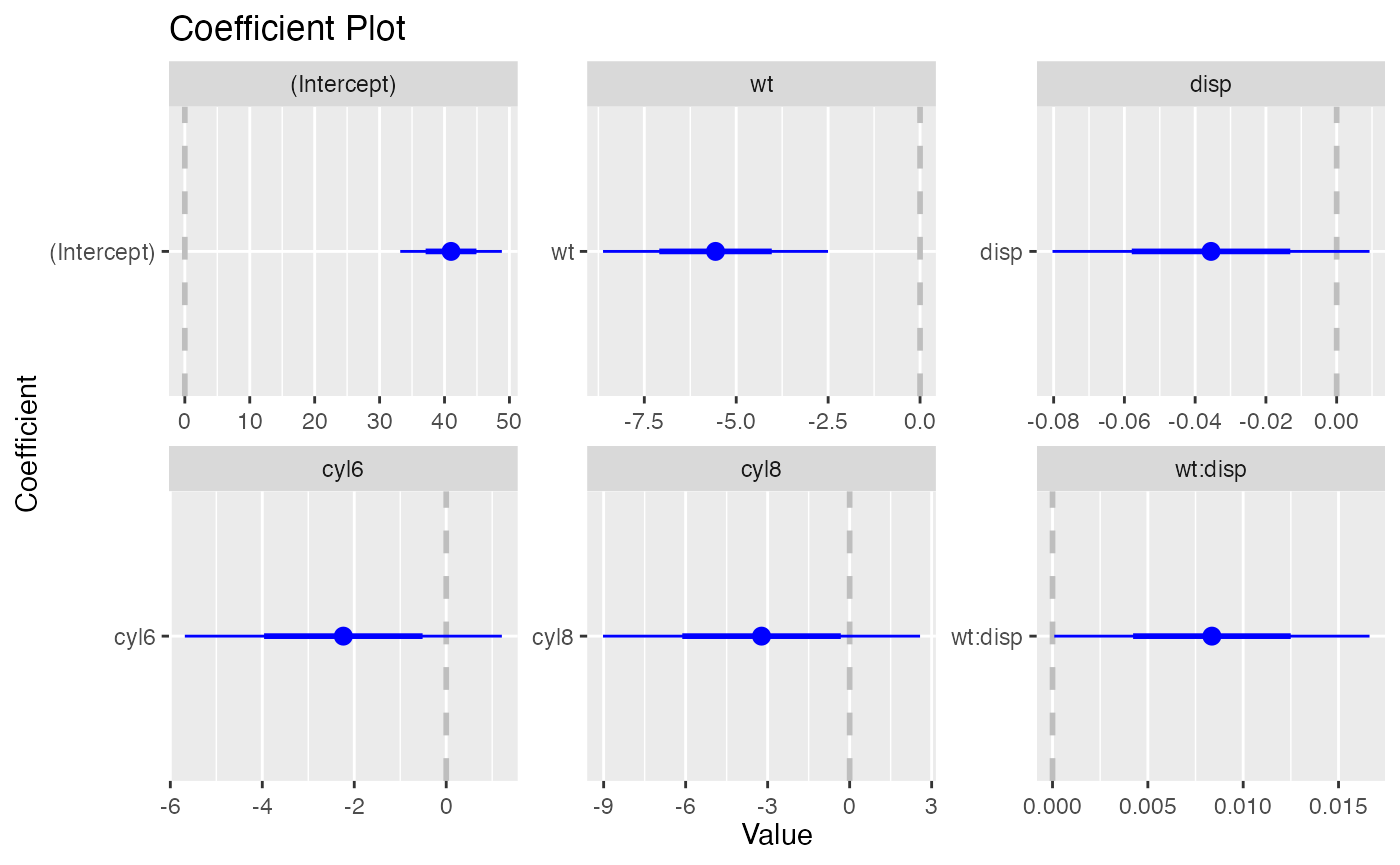
model <- lm(mpg ~ wt*disp + cyl, data = dt)
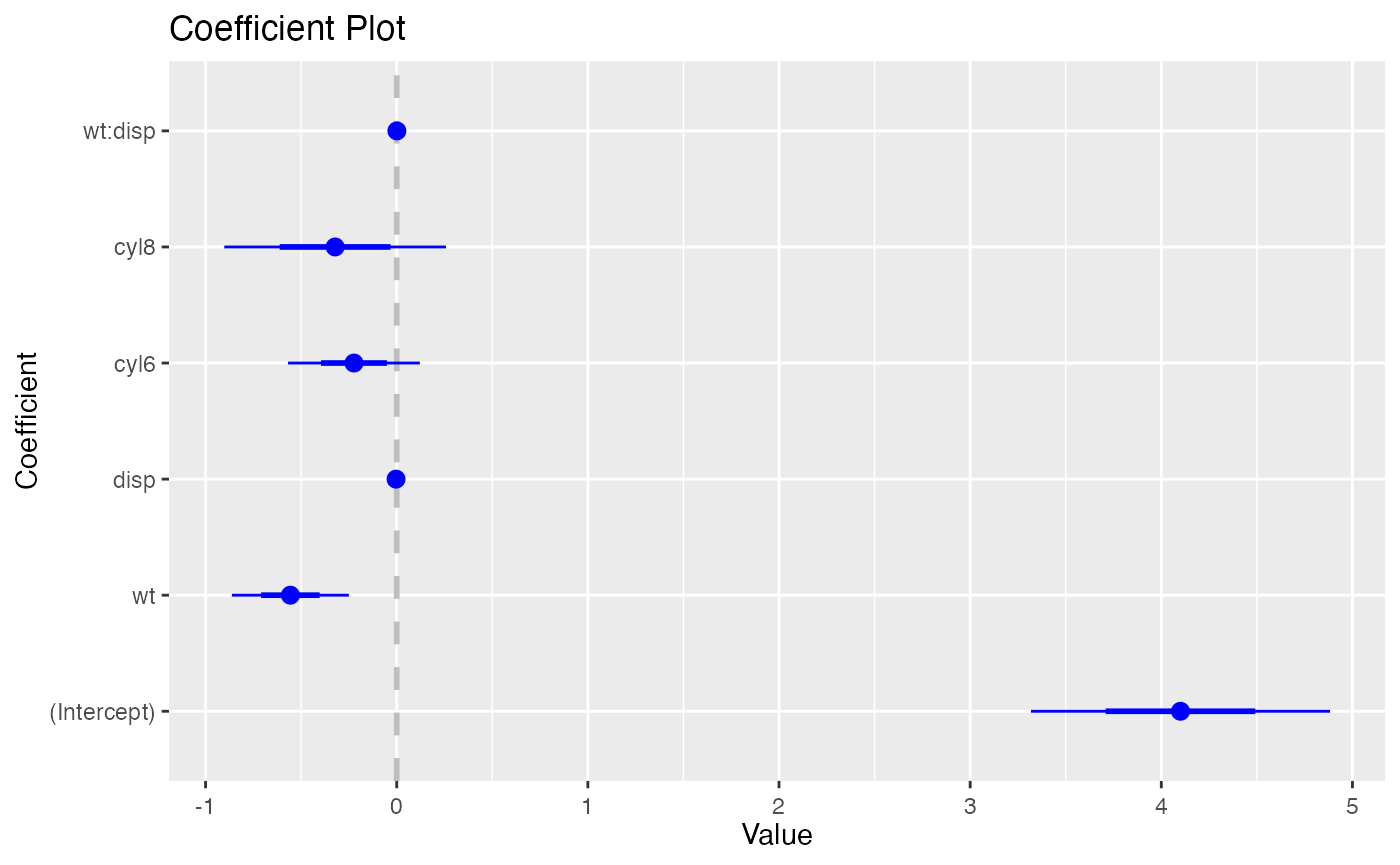
Labels
title, xlab, and ylab
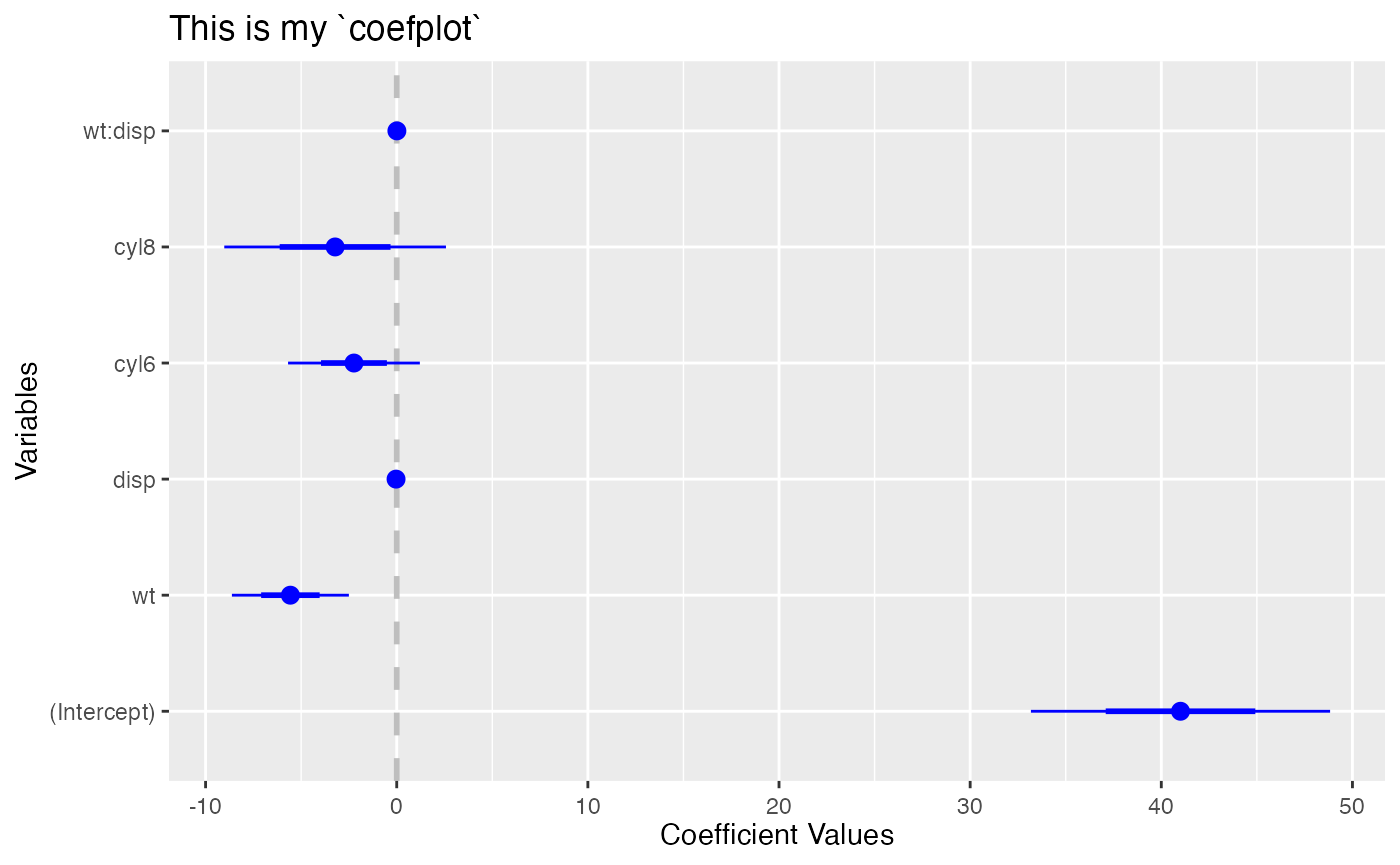
coefplot(
  model,
  title = 'This is my `coefplot`',
  xlab = 'Coefficient Values',
  ylab = 'Variables'
)
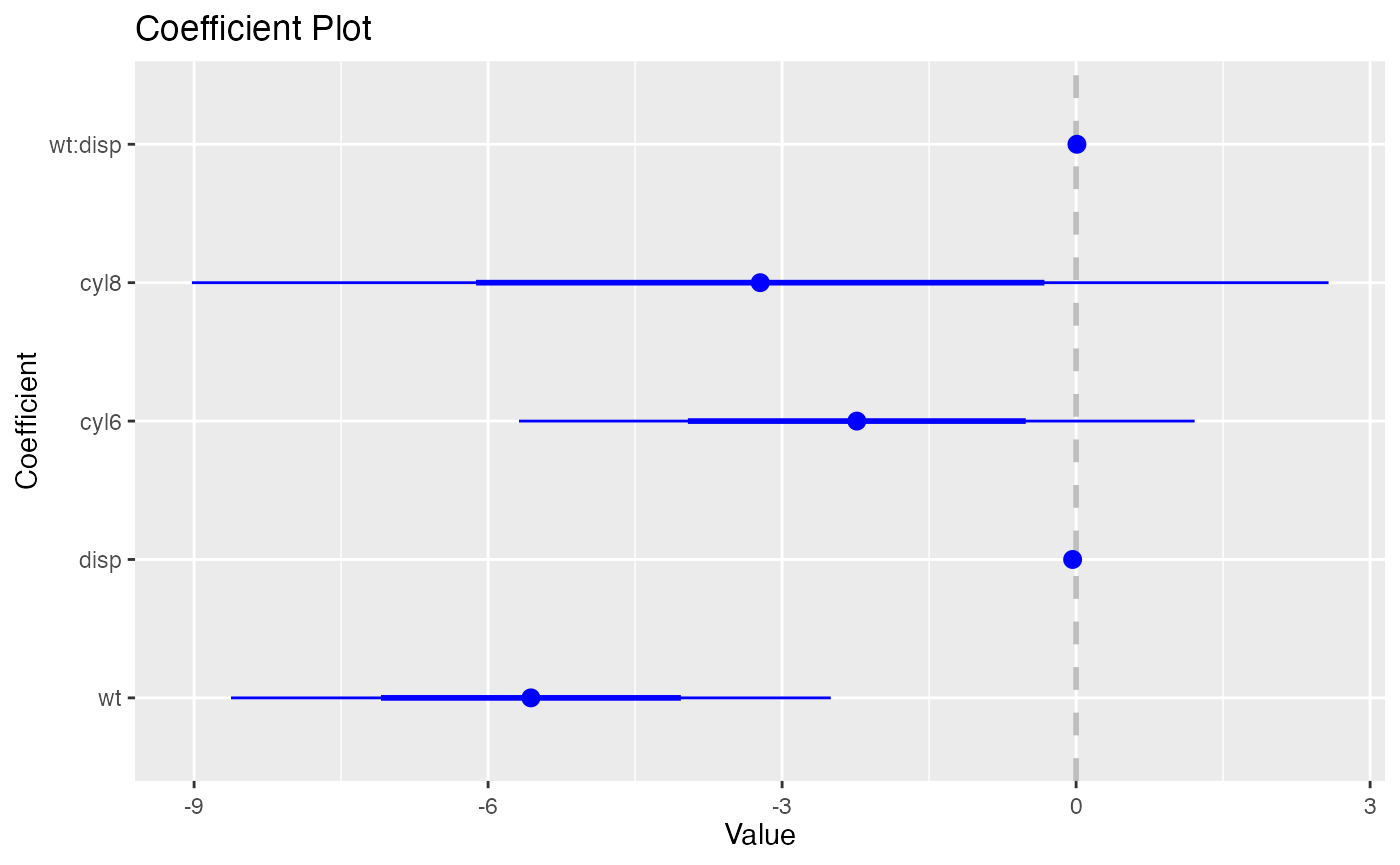
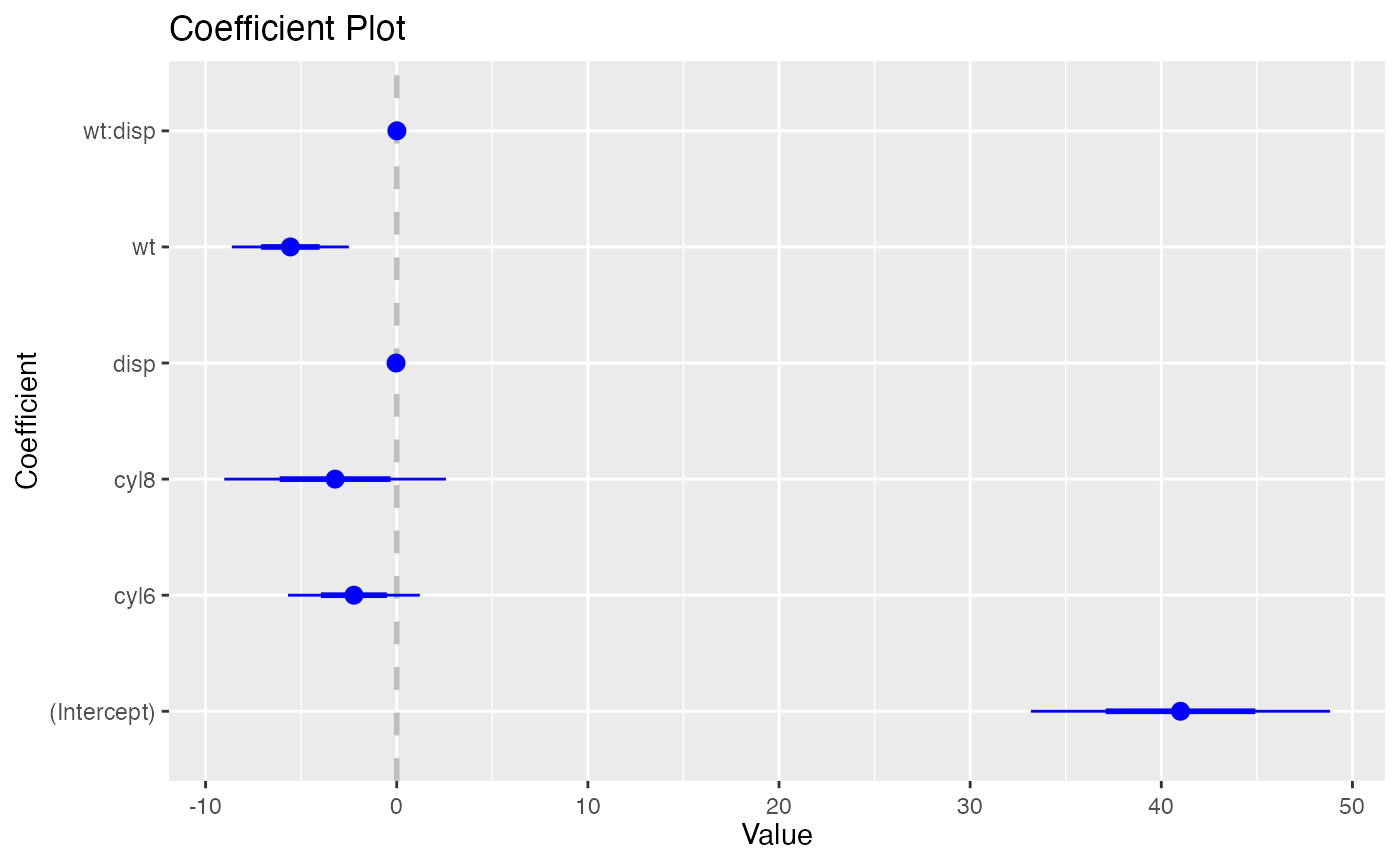
Coefficients
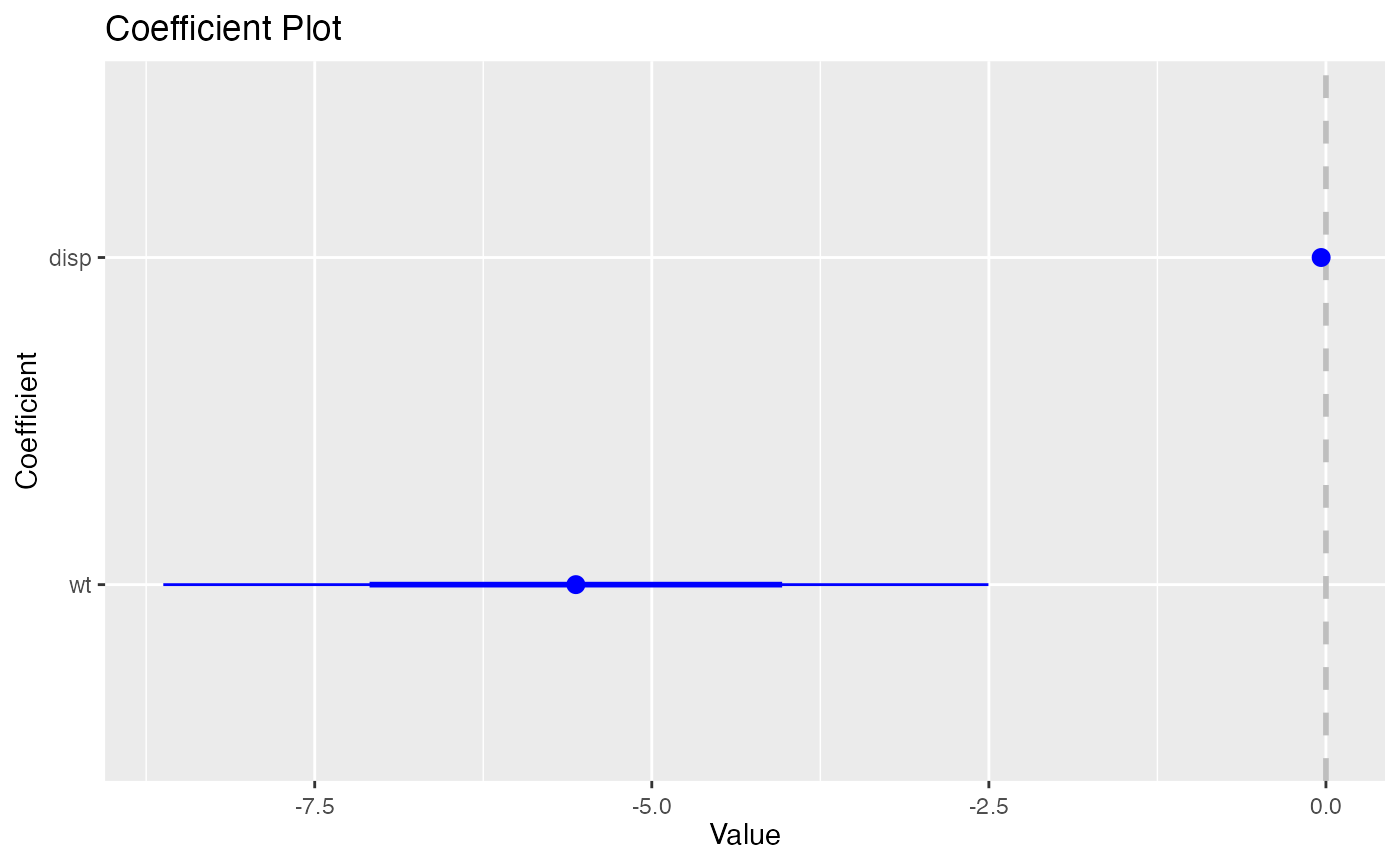
innerCI/outerCI and
lwdInner/lwdOuter and
pointSize
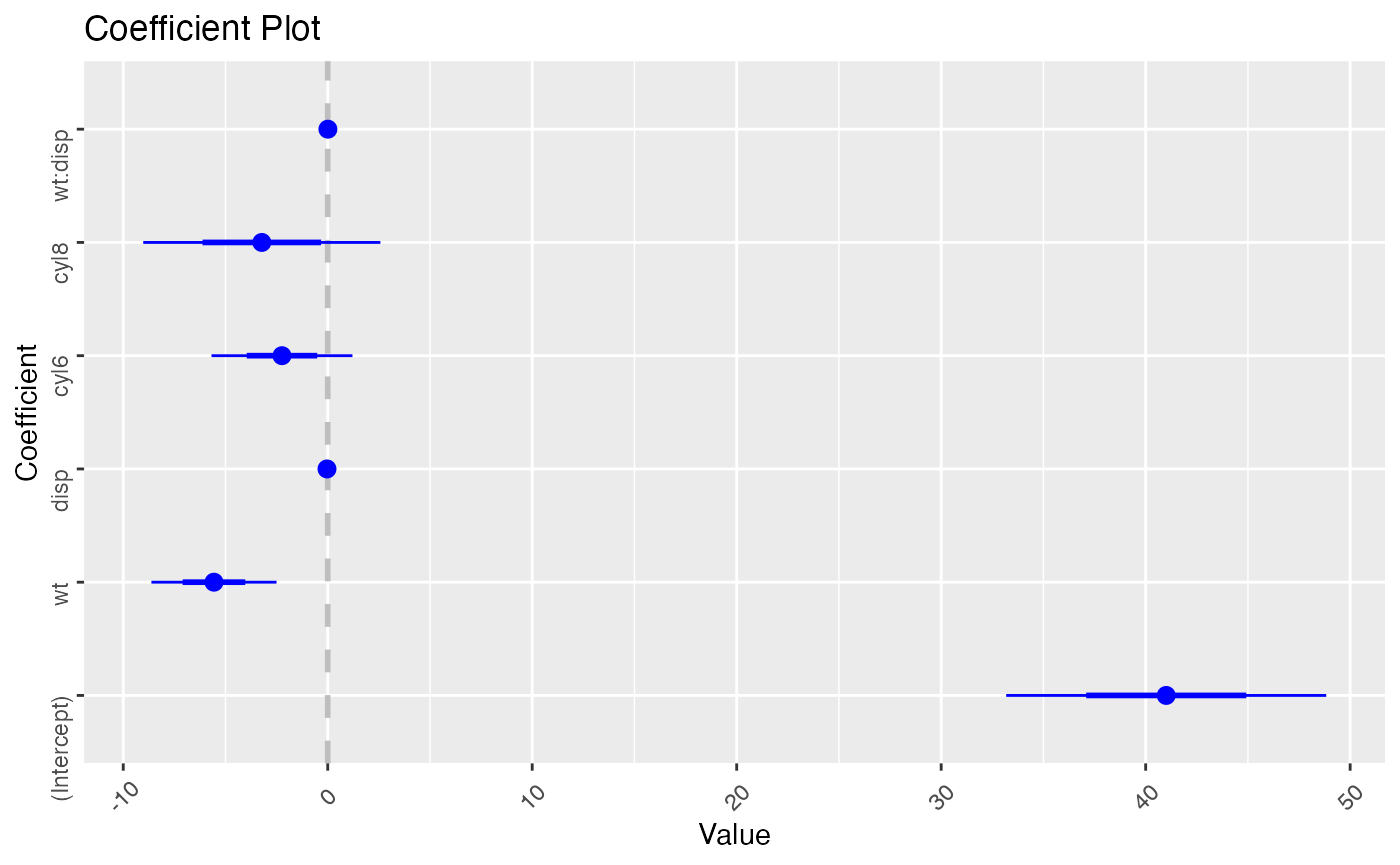
coefplot(
  model,
  innerCI = 1.5,
  lwdInner = 2,
  outerCI = 3,
  lwdOuter = .5,
  pointSize = 3.5
)
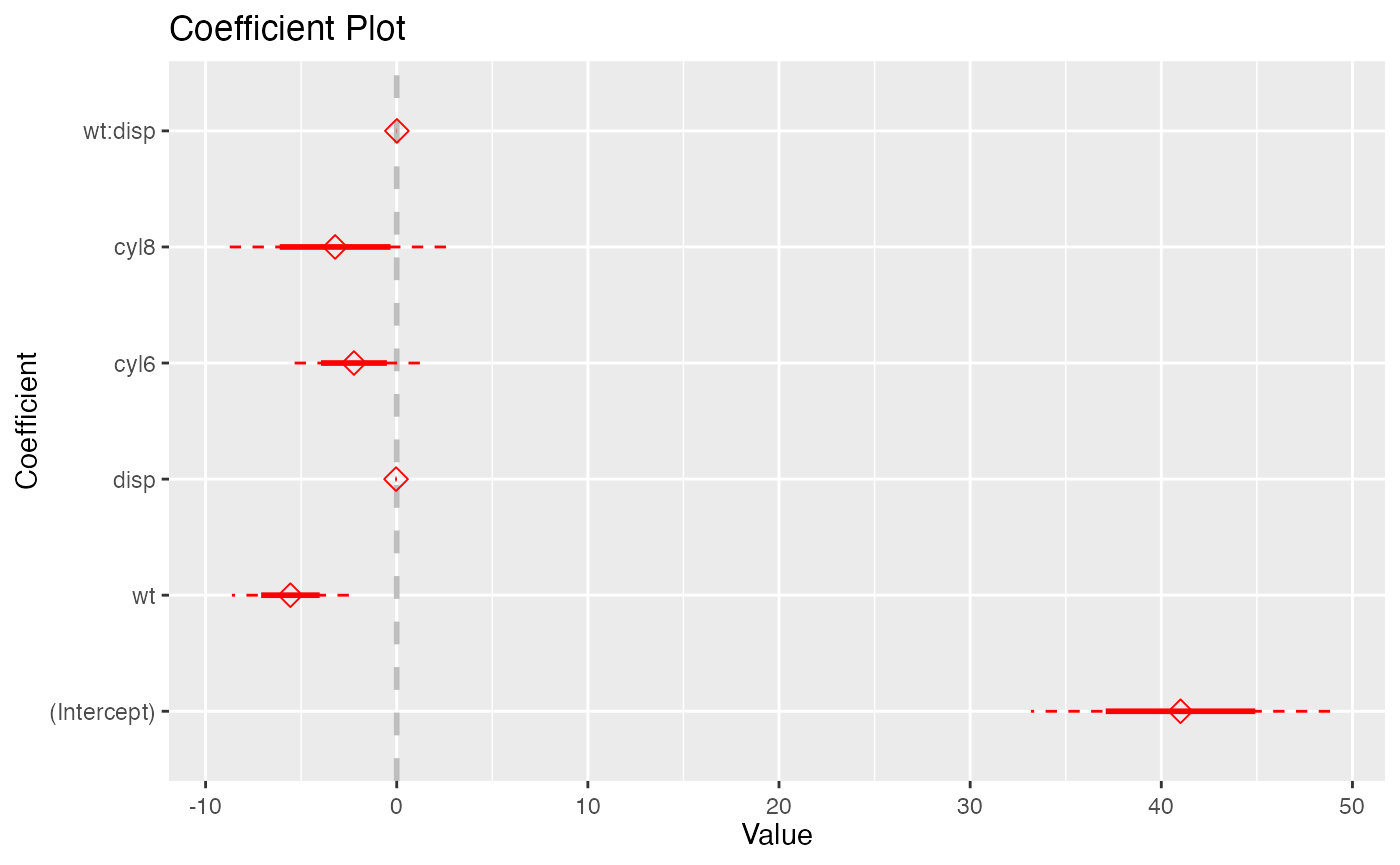
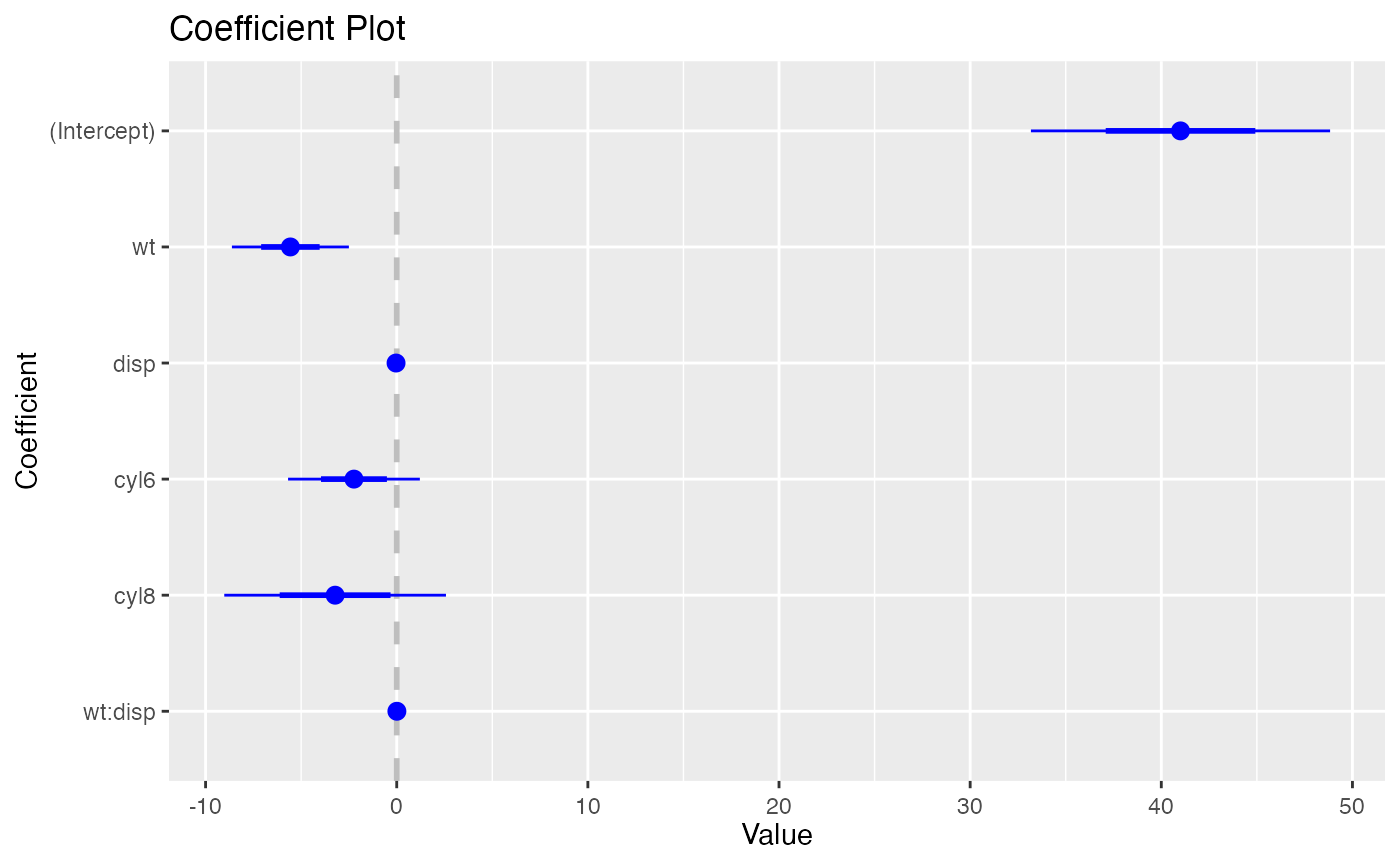
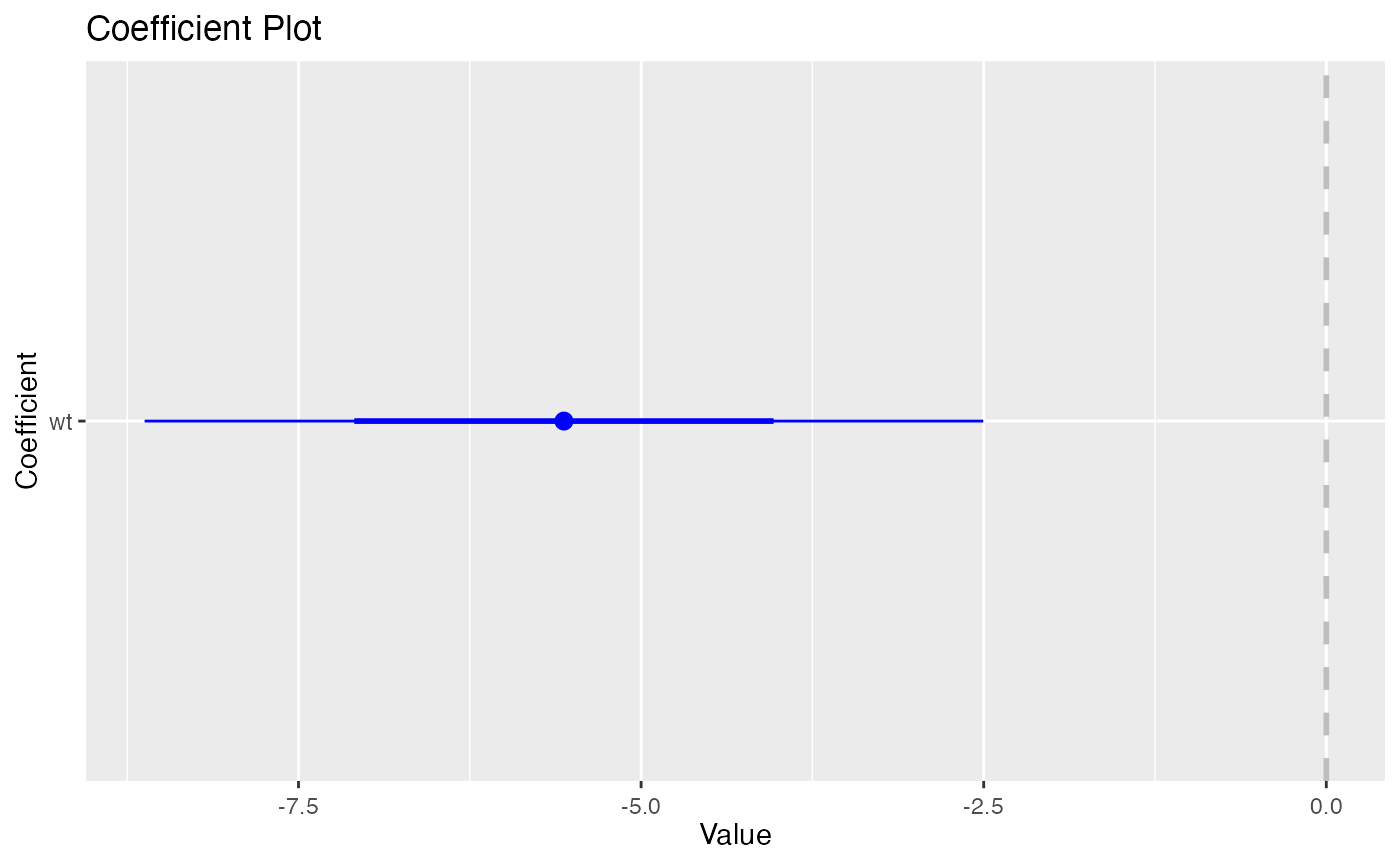
color, shape, and
linetype
See the ggplot2 documentation on differentiation
to learn more.
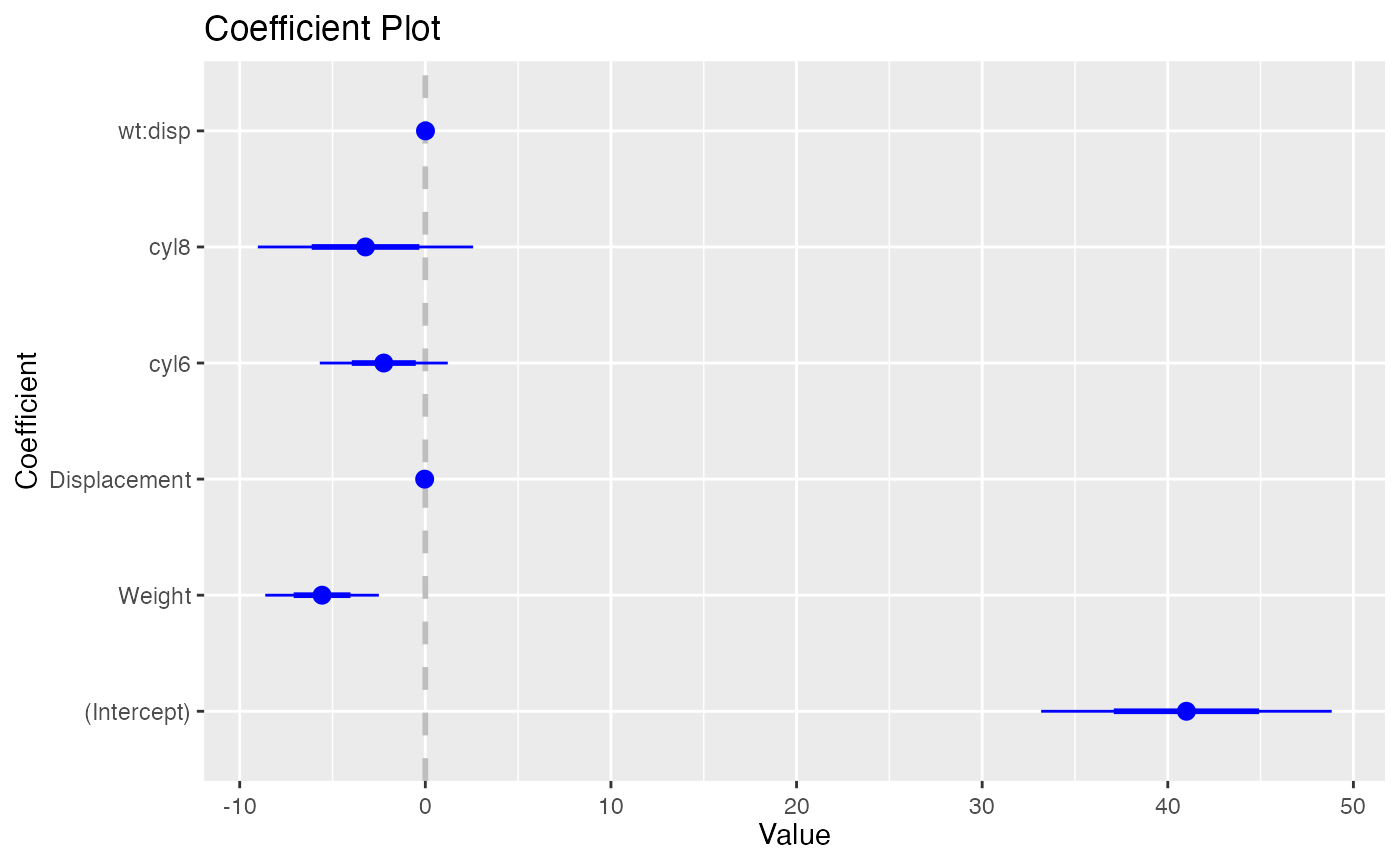
coefplot(
  model,
  color = 'red',
  shape = 23,
  outerType = 2
)